
- Welcome to Simply Fortran
- Purchasing and Activating Simply Fortran
- Using Simply Fortran
- The Simply Fortran Interface
- Editing in Simply Fortran
- Projects in Simply Fortran
- Building Projects
- Launching Projects
- Debugging Programs
- External Tools
- Version Control
- Options and Configuration
- Licensing
Examining the Stack
While debugging, the call stack can be examined and navigated via the Debugging panel in Stack mode. The panel is shown below:
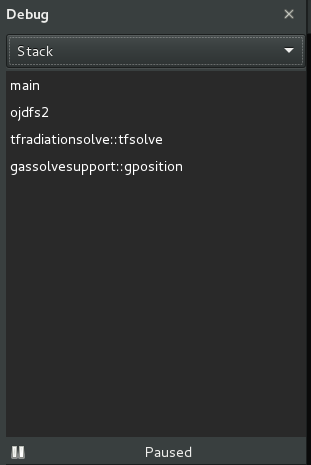
The lowest level of the stack, the last-called subprogram, is listed at the bottom of the list, and the history of reaching said subprogram appears sequentially above the entry. Clicking on any procedure will open the file in which the subprogram exists and switches to that stack frame. The Variables panel should now reflect values in that stack frame.
Entries labeled with “??” indicate that the debugger cannot determine the name of the procedure or stack frame being represented. Double-clicking on these entries will not work as debugging information is not available.