
- Welcome to Simply Fortran
- Purchasing and Activating Simply Fortran
- Using Simply Fortran
- The Simply Fortran Interface
- Editing in Simply Fortran
- Projects in Simply Fortran
- Building Projects
- Launching Projects
- Debugging Programs
- External Tools
- Version Control
- Options and Configuration
- Licensing
Debugging in Simply Fortran
The Simply Fortran integrated development environment includes debugging capabilities, allowing users to step through programs, examine variables, and locate runtime bugs. The debugger seamlessly calls the powerful GNU Debugger to perform this task, but all operations are handled directly by Simply Fortran itself.
Debugging provides users with the ability to interact with their running programs, setting points at which execution should pause (breakpoints), switching between the current subprogram and the calling subprogram(s) via moving through the call stack, and examining data within the executing program. As the name suggests, the debugger can make locating and eliminating bugs within a project far simpler than relying purely on program outputs.
Starting the Debugger
If working with an executable project, the debugger can be started by selecting Start from the Debug menu. When working with a library project, either shared or dynamically linked, starting the debugger from Start in the Debug menu will launch the executable specified in the Launch category of Project Options.
If debugging has been disabled in the compiler options, you may receive a warning asking you to first enable the option. After enabling debugging, be sure to first clean and building the project.
Once the debugger has started, the program should proceed to the main procedure where a temporary breakpoint will cause the program to pause.
Attaching to a Running Process
As an alternative to launching a program directly for debugging, the user may also connect Simply Fortran’s debugger to a running process. This procedure can be especially useful for debugging shared libraries created with Simply Fortran and called by another program or long-running programs experiencing intermittent crashes or other bugs.
If the user has a project that creates a shared library used by another program, the project pertaining to said library should first be loaded. By initially loading the project, the user can set breakpoints and add watches related to the shared library prior to attaching to the executable.
When the debugger attaches to a process, the process is not interrupted. Instead, the process will continue running. If breakpoints or watches are needed after attaching to the process, these breakpoints and watches must be set prior to attaching to the process.
Once attached to the process, the Simply Fortran debugger will continue to operate as if the process was started by Simply Fortran itself.
Debugger Interface
Debugging controls are located in a number of convenient positions within Simply Fortran. The sections that follow provide a brief overview of the debugger interface.
The Debug Menu
The menu offers access to the major components of the debugger. Within the menu, the following options are available:
| Start | Starts up the debugger and proceeds to the main procedure of the program. Once started, other debugging options will become available. |
| Restart | Causes the debugger to stop the program at its current location, exit the program, and restart it fresh at its main procedure. |
| Stop | Stops the debugger entirely and exits the currently running program. |
| Attach | Attaches to a currently running program rather than starting a program directly. See above for more details. |
| Step Over, Step In, Step Out | Controls stepping through the program. See Stepping for more information. |
| Continue | If the program is currently paused, this option allows the program to proceed until either the next breakpoint or the program exits. |
| Continue to Cursor | If the program is currently paused, this option allows the program to proceed until the line where the cursor lies is reached. Any breakpoints reached prior to reaching the cursor are still respected. If the cursor is on a line that will not be executed due to a conditional structure, the program will continue indefinitely. |
| Add Watch Expression… | Allows the manual entry of a valid expression to be watched as the program proceeds. See Watch for more information. |
| Clear All Watch Expressions | Clears all expressions being watched. See Watch for more information. |
| Clear All Breakpoints | Clears all breakpoints. See Breakpoints for more information. |
Debugger Toolbar Entries
Simply Fortran’s toolbar contains buttons for controlling the flow of the debugger. The buttons appear below:

The green insect will start the debugger, similar to the Debug menu entry. The remaining icons are normally disabled unless the debugger has already been started.
The first restarts the program being debugged. The second, third, and fourth allow stepping into, over, or out of subprograms; see Stepping for more information on these actions. The fifth button allows program execution until either the next breakpoint is reached or execution terminates. The sixth button will allow the user to run the program until the line on which the cursor lies is reached (Continue to Cursor). The final button stops the current debugging session.
The Debugger Panel
The leftmost panel in Simply Fortran has a debugging mode which displays information available from the debugger and allows some interaction with the debugger. The mode of the debugger panel can be switched using the drop-down present at the top of the panel. The various modes are:
The default mode is Variables, which will display values of local variables while the debugger is running.
To quickly switch modes, the user can press the + (Plus) or – (Minus) signs on the number pad while holding down Command. Command + will move down the list of modes, Command – will move up the list.
Debugging and the Editor
Some debugging information can be viewed directly within the editor, and, conversely, the editor can provide convenient interaction with the debugger.
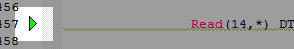
When the debugger is running, the current program position will be shown whenever the debugger reaches a breakpoint. The current position is always marked by a green arrow:
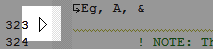
Where appropriate, the call stack will also be shown in appropriate locations, as indicated by white arrows:
These indicators will only be visible when the debugger is running.
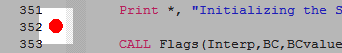
Clicking in the editor margin, either on the column where line numbers may or may not be shown or just left of the folding margins, will insert a breakpoint into the code, as indicated by the following symbol:
A breakpoint can be removed by clicking the same symbol that was inserted.
A breakpoint can be inserted on any line in the Simply Fortran editor. The debugger will actually store the breakpoint at the next executable line.
While the debugger is running the user can highlight text within the editor for debugging actions. If the user then right-clicks on the highlighted word, opening the editor context menu, the Debugging submenu allows the user to toggle a breakpoint on the current line or add the highlighted text as a watch variable immediately. If the user holds the mouse cursor over the highlighted text, the value of the currently selected text will pop up after 1.5 seconds. Note that arrays and derived types will only show up as containing further contents rather than expanding all their values.
See Also
Breakpoints
Stack
Threads
Variables
Watches
Stepping
Editing in Simply Fortran
Project Options