
Integrated Debugger


Simply Fortran includes an integrated, source-level debugger and all the features professionals expect. Powered by the GNU Debugger, Simply Fortran allows for the creation of breakpoints and watch expressions. Highlighting and hovering over source code while debugging allows the highlighted expression to be evaluated, popping up the calculated value next to the selection.
Simple Controls
Walking through your source code while debugging is easy with Simply Fortran. From the Debug menu or the toolbar, users have access to expected controls: Step Over, Step In, Step Out, and Continue. Hotkeys make stepping through the code even easier. Indicators within the margin of the editor shows the current position while debugging, including locations of calls that led to the current debugging position.
Viewing Variables
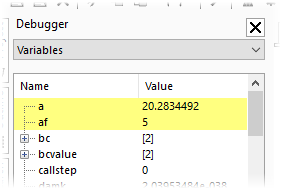
Any time the debugger reaches a breakpoint or the user manually steps to a new location, Simply Fortran updates the local variables and watch expression displays. Any variable that have changed since the last breakpoint are highlighted. Multidimensional arrays and Fortran derived types can be easily expanded to view individual entries.