Embedding Plots in AppGraphics
Posted on 2022-11-09
Simply Fortran has included a simplistic plotting library for quite some time called Aplot that allows developers to quickly produce graphical representations of data in Fortran. The library has always been designed to be simple to the point of being minimalistic. Available on all platforms that we support, the library has seen significant employ by our end users.
Simply Fortran 3.26 for Windows now includes a handful of new features in Aplot that are restricted to that platform. Notably, Aplot windows can now be asynchronously opened and programatically closed. Due to the nature of the Windows API, these changes are easy to introduce on this platform, but they probably won't be ported to macOS and GNU/Linux.
This article, however, will discuss another new Windows-specific feature: embedding plots in AppGraphics windows.
The Relationship Between Aplot and AppGraphics
Behind the scenes, Aplot on Windows has always used AppGraphics as its backend. In current and former releases of Aplot, the library, when requested, will create a new AppGraphics window and draw the plot into it. Due to some earlier design decisions, allowing users to access this functionality, targetting arbtirary AppGraphics windows, wasn't feasible.
With the release of version 3.26, we've corrected some issues with Aplot that does make the drawing of plots in arbitrary AppGraphics windows possible with some important caveats. The best way to discuss this functionality and its limitations is to produce a simple example.
Two Random Datasets
For this article, we'll generate two random datasets of twenty points. Since we want to work with line plots, we'll base every subsequent point in the previous point. Consider the following code that generates two 20-point datasets sharing the same X-axis data:
real, dimension(20)::x, y1, y2
real, dimension(2)::delta
integer::i

x(1) = 0.0
y1(1) = 1.0
y2(1) = 2.0

! Generate Data
do i = 2, 20
    x(i) = real(i-1)
    call random_number(delta)
    y1(i) = y1(i-1) + 0.2*delta(1)
    y2(i) = y2(i-1) + 0.2*delta(2)
end do
We're effectively creating two series that are always increasing, though by a random amount each step. Our goal in this example is to create a window to plot this data in a windows where we can control which data we're plotting.
Creating Our AppGraphics Window
Our window for this project will be a simple, rectangular window. Ideally, we need a pair of checkboxes to determine which datasets should be plotted:
integer::myscreen
integer, dimension(2)::checkboxes
integer::myclosebutton

myscreen = initwindow(400, 500, closeflag=.TRUE.)
call setcolor(BLACK)
call setbkcolor(WHITE)
call clearviewport()

! Plot controls
checkboxes(1) = createcheckbox(10, 425, 200, 20, "Dataset 1", dataset_changed)
checkboxes(2) = createcheckbox(10, 450, 200, 20, "Dataset 2", dataset_changed)

myclosebutton = createbutton(330, 467, 65, 28, "Close", stopidle)

! To initialize the display...
call dataset_changed()
In this code block, we open a window, set up some colors, generate two checkboxes and close button, and initialize our plotting. We'll leave the plotting to our dataset_changed callback subroutine.
Plot Initialization
Before we get to actually drawing a plot, we need to create it. In a case where we are embedding a plot, we actually still need to generate an aplot_t variable and set up our datasets. If we were to plot both datasets, these steps would be:
    type(aplot_t)::p

    p = initialize_plot()

    call add_dataset(p, x, y1)
    call set_serieslabel(p, 0, "Dataset 1")
    call set_seriestype (p, 0, APLOT_STYLE_LINE)

    call add_dataset(p, x, y2)
    call set_serieslabel(p, 1, "Dataset 2")
    call set_seriestype (p, 1, APLOT_STYLE_LINE)

    call set_xlabel(p, "Point")
    call set_ylabel(p, "Value")
The above code would generate an aplot_t variable, p, that would be ready to plot both datasets. In our case, though, we have checkboxes available to limit which datasets are plotted. We could change this slightly to create our p variable with only the needed datasets:
    type(aplot_t)::p
    integer::series_count

    series_count = 0

    ! When data is selected, we'll create an entirely new plot
    ! object each time.  Datasets in plot objects can't be
    ! "updated," so we need to start from scratch.
    p = initialize_plot()

    if(checkboxischecked(checkboxes(1))) then
        call add_dataset(p, x, y1)
        call set_serieslabel(p, series_count, "Dataset 1")
        call set_seriestype (p, series_count, APLOT_STYLE_LINE)
        series_count = series_count + 1
    end if

    if(checkboxischecked(checkboxes(2))) then
        call add_dataset(p, x, y2)
        call set_serieslabel(p, series_count, "Dataset 2")
        call set_seriestype (p, series_count, APLOT_STYLE_LINE)
    end if

    call set_xlabel(p, "Point")
    call set_ylabel(p, "Value")
There is also the issue of not selecting any datasets which we have to handle:
    type(aplot_t)::p
    integer::series_count

    ! If nothing is selected, let the user know
    if(.not. checkboxischecked(checkboxes(1)) .and. &
       .not. checkboxischecked(checkboxes(2))) then

        ! Tell the user nothing is selected to plot

    else

        series_count = 0

        ! When data is selected, we'll create an entirely new plot
        ! object each time.  Datasets in plot objects can't be
        ! "updated," so we need to start from scratch.
        p = initialize_plot()

        if(checkboxischecked(checkboxes(1))) then
            call add_dataset(p, x, y1)
            call set_serieslabel(p, series_count, "Dataset 1")
            call set_seriestype (p, series_count, APLOT_STYLE_LINE)
            series_count = series_count + 1
        end if

        if(checkboxischecked(checkboxes(2))) then
            call add_dataset(p, x, y2)
            call set_serieslabel(p, series_count, "Dataset 2")
            call set_seriestype (p, series_count, APLOT_STYLE_LINE)
        end if

        call set_xlabel(p, "Point")
        call set_ylabel(p, "Value")
Now we probably have a valid plot variable p, although we'll need to handle the "nothing selected" case as well. Next, we'll integrate with AppGraphics.
Embedding the Plot
We can further enhance our code for plotting thus far with some AppGraphics calls. In the first section, we created a rectangular window, 400 by 500 pixels, where we'd like to display our plot and controls. We'll restrict our plot to the top 400 pixels of the window. First, we need to add code to clear the area where we're plotting:
call setbkcolor(WHITE)
call setviewport(0, 0, 400, 400, .true.)
call clearviewport()
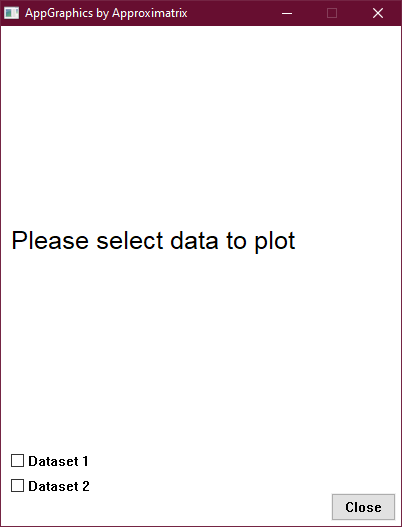
We also have the issue of notifying the user that there is no data selected, which we can handle with a simple text output block within that area:
call settextstyle(SANS_SERIF_FONT, HORIZ_DIR, 28)
call setcolor(BLACK)
call outtextxy(10, 200, "Please select data to plot")
Embedding the plot is actually simple. In the case where we have a valid aplot_t variable p that we've populated with the necessary information, embedding is as simple as:
call embed_plot(p, myscreen, 0, 0, 400, 400)
Recall that the myscreen variable holds the identifier of our AppGraphics window. The last four arguments in the call to embed_plot, our new Aplot API call, are just the X and Y coordinates of the top-left of our plot area and the width and height of the plot area.
Some other code earlier may seem somewhat verbose in that it explicitly sets colors, font sizes, viewports, etc. every time it is called. This code is necessary because the embed_plot call will reset a number of states within AppGraphics, notably the viewport, fonts, and colors. Developers need to be aware that Aplot will reset these to its preferred values every time it is called.
The call to embed_plot draws the Aplot p variable exactly once to the active page. It does not handle any other cases whatsoever. This detail means that if the active page changes (as in double-buffering), the user adjusts a setting for the plot, or a window resize occurs, the plot will need to be redrawn with another call to embed_plot. In other words, nothing is automatic.
Handling Changes
In our example, we want to include or exclude our datasets based on checkboxes that the user will click. If you recall, we created checkboxes with a callback to the subroutine dataset_changed that will handle plotting internally. As explained, though, we cannot change existing aplot_t variables, so we would need to create new aplot_t variables every time our plot parameters changed. We can handle this inside our callback:
subroutine dataset_changed()
use aplot
use appgraphics
implicit none

    type(aplot_t)::p
    integer::series_count

    call setbkcolor(WHITE)
    call setviewport(0, 0, 400, 400, .true.)
    call clearviewport()

    ! If nothing is selected, let the user know
    if(.not. checkboxischecked(checkboxes(1)) .and. &
       .not. checkboxischecked(checkboxes(2))) then

        call settextstyle(SANS_SERIF_FONT, HORIZ_DIR, 28)
        call setcolor(BLACK)
        call outtextxy(10, 200, "Please select data to plot")

    else

        series_count = 0

        ! When data is selected, we'll create an entirely new plot
        ! object each time.  Datasets in plot objects can't be
        ! "updated," so we need to start from scratch.
        p = initialize_plot()

        if(checkboxischecked(checkboxes(1))) then
            call add_dataset(p, x, y1)
            call set_serieslabel(p, series_count, "Dataset 1")
            call set_seriestype (p, series_count, APLOT_STYLE_LINE)
            series_count = series_count + 1
        end if

        if(checkboxischecked(checkboxes(2))) then
            call add_dataset(p, x, y2)
            call set_serieslabel(p, series_count, "Dataset 2")
            call set_seriestype (p, series_count, APLOT_STYLE_LINE)
        end if

        call set_xlabel(p, "Point")
        call set_ylabel(p, "Value")

        call embed_plot(p, myscreen, 0, 0, 400, 400)

        ! Once drawn, we don't acutally need this plot anymore
        call destroy_plot(p)

    end if

    call resetviewport()

end subroutine dataset_changed
The callback has one important addition in cases where we are plotting data. After the call to embed_plot, we immediately call destroy_plot to destroy our variable p and release its associated memory. As pointed out earlier, once a plot is drawn, it cannot be changed. Perhaps if we were not changing any data, we cuold keep the same plot in memory to redraw it when, for example, a resize event occurs. In our case, however, we aren't allowing resizing. Once this callback executes, the plot is drawn, and there is no reason to keep that memory allocated. It can be immediately released via the destroy_plot call.
Putting Everything Together
Our simple program can now be fully assembled into a working state:
program main
use appgraphics
use aplot
implicit none

    integer::myscreen
    integer, dimension(2)::checkboxes
    integer::myclosebutton

    real, dimension(20)::x, y1, y2
    real, dimension(2)::delta
    integer::i

    myscreen = initwindow(400, 500, closeflag=.TRUE.)
    call setcolor(BLACK)
    call setbkcolor(WHITE)
    call clearviewport()

    x(1) = 0.0
    y1(1) = 1.0
    y2(1) = 2.0

    ! Generate Data
    do i = 2, 20
        x(i) = real(i-1)
        call random_number(delta)
        y1(i) = y1(i-1) + 0.2*delta(1)
        y2(i) = y2(i-1) + 0.2*delta(2)
    end do

    ! Plot controls
    checkboxes(1) = createcheckbox(10, 425, 200, 20, "Dataset 1", dataset_changed)
    checkboxes(2) = createcheckbox(10, 450, 200, 20, "Dataset 2", dataset_changed)

    myclosebutton = createbutton(330, 467, 65, 28, "Close", stopidle)

    ! To initialize the display...
    call dataset_changed()

    call loop()

    call closewindow(myscreen)

contains

    subroutine dataset_changed()
    use aplot
    use appgraphics
    implicit none

        type(aplot_t)::p
        integer::series_count

        call setbkcolor(WHITE)
        call setviewport(0, 0, 400, 400, .true.)
        call clearviewport()

        ! If nothing is selected, let the user know
        if(.not. checkboxischecked(checkboxes(1)) .and. &
           .not. checkboxischecked(checkboxes(2))) then

            call settextstyle(SANS_SERIF_FONT, HORIZ_DIR, 28)
            call setcolor(BLACK)
            call outtextxy(10, 200, "Please select data to plot")

        else

            series_count = 0

            ! When data is selected, we'll create an entirely new plot
            ! object each time.  Datasets in plot objects can't be
            ! "updated," so we need to start from scratch.
            p = initialize_plot()

            if(checkboxischecked(checkboxes(1))) then
                call add_dataset(p, x, y1)
                call set_serieslabel(p, series_count, "Dataset 1")
                call set_seriestype (p, series_count, APLOT_STYLE_LINE)
                series_count = series_count + 1
            end if

            if(checkboxischecked(checkboxes(2))) then
                call add_dataset(p, x, y2)
                call set_serieslabel(p, series_count, "Dataset 2")
                call set_seriestype (p, series_count, APLOT_STYLE_LINE)
            end if

            call set_xlabel(p, "Point")
            call set_ylabel(p, "Value")

            call embed_plot(p, myscreen, 0, 0, 400, 400)

            ! Once drawn, we don't acutally need this plot anymore
            call destroy_plot(p)

        end if

        call resetviewport()

    end subroutine dataset_changed

end program main
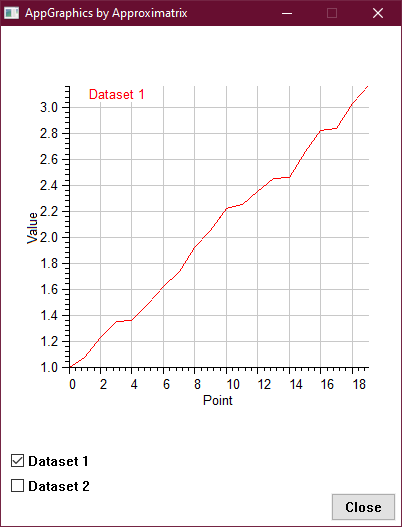
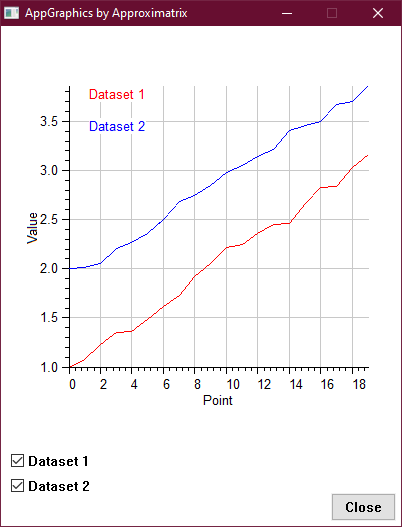
When we run the program, we'll get a pleasant window with a plot that changes based on the checkboxes selected by the user:


